Global Warming Prediction Project

What Drives Global Warming?
13.09.2011

To say it upfront: It is NOT CO2. Not necessarily and not exclusively. Looking at observational data by high-performance self-organizing predictive knowledge mining, it is not confirmed that atmospheric CO2 is the major force of global warming. In fact, no direct influence of CO2 on global temperature has been identified for the best models. This is what the data are seriously telling us. If we believe them, it is the sun, ozone, aerosols, and clouds - and possibly other forces not considered in this model - that drive global temperature in an interdependent and complex way.
Models and software can be downloaded here free.
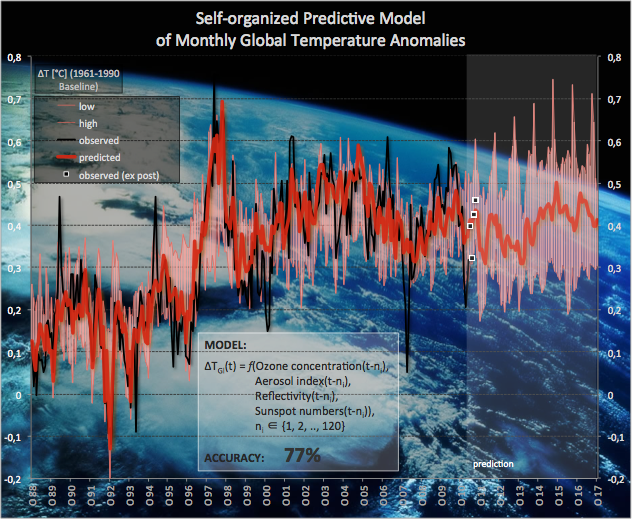
The self-organized model builds a dynamic system model - a system of nonlinear difference equations. The model shows a high accuracy of 77% given the fact that there is noise and uncertainty in the observational data. Figure 1 plots the observed vs predicted global temperature anomalies of this model retrospectively for the past 23 years and predictively for the next 6 years till October 2017. It is supplemented by the uncertainty of the predictions as a range where actual temperatures will most likely be observed in.
Concluding from that graph, no significant further global warming is expected in the coming 6 years. Temperatures rather remain at the current level of warming. This is confirmed, so far, by the most recent global warming observed ex post (April - July 2011; square dots in fig. 1). This does not contradict the fact that there still may be regions where temperature will continue growing since the global temperature represents the average of surface temps over the entire globe. In fact, recent warming predictions of 9 latitudinal bands show that there are very different regional developments.

Figure 1. Actual (black) vs predicted (dark and light red) plot of global temperature anomalies from October 1988 to October 2017. The square dots (April - July 11) show temperatures observed after the model has been built in April 2011. They confirm the accuracy of the predictions made by the system model at that earlier point in time.
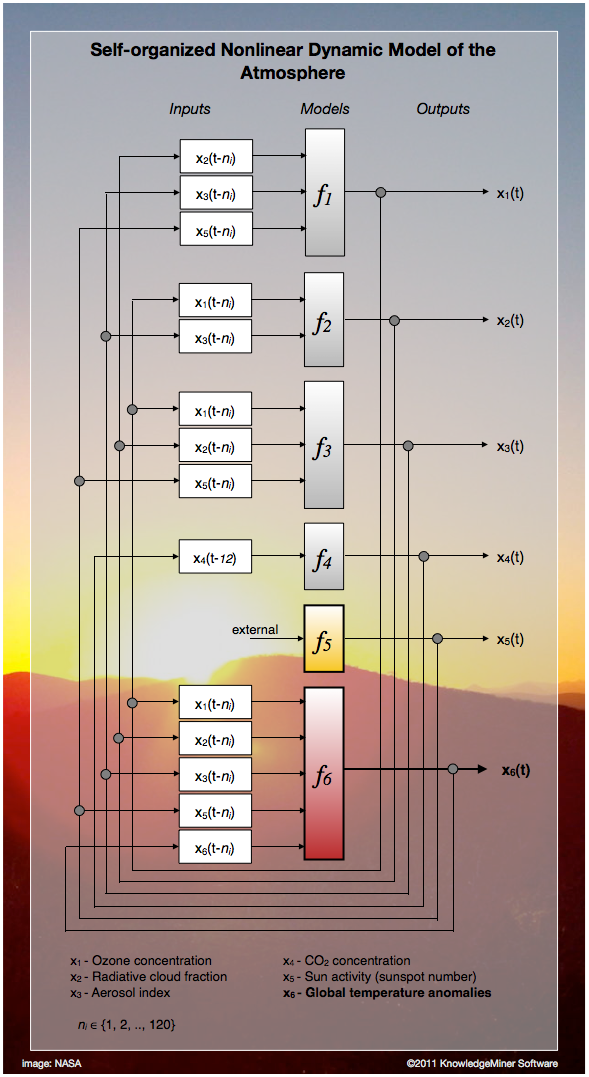
Figure 2 outlines the interdependence structure of the dynamic system model obtained by model self-organization. Ozone concentration (x1), for example, affects cloud fraction (x2), aerosol concentration (x3), and global temperature (x6) while it is influenced in turn by cloud fraction, aerosols, and sun activity (x5) at certain earlier points in time. This interdependence applies to all other system variables, correspondingly, so that there is no clear, simple, single cause-effect chain in this system. Instead, dependencies between system variables become an interwoven pattern and it‘s hard to tell what is cause and what is effect. This is characteristic for complex real-world systems (Müller, 2000).
Such complex dynamic interdependence pattern has been automatically identified from data for all system variables except for CO2 (x4). The atmospheric CO2 at a time is described very well by the CO2 concentration observed 12 months before, exclusively (auto-regressive model). This model has been posted earlier. However - and this is a most important finding -, CO2 does also not influence any other of the system variables including global temperature. It remains completely autonomous (see f4-loop in fig. 2). This contrasts what has been communicated in the past years, but this is what the data are telling us when we are able to extract the hidden knowledge about the atmospheric system from that data appropriately, objectively and open in result.

Figure 2. Self-organized system model of global warming as a nonlinear system of difference equations
representing a network of interdependent input-output relationships. The models f1 to f6 are available
analytically and they show high dynamics by time lags of up to 120 months.
Why should it matter if CO2 do really drive Global Warming or not?
The current mental model of Global Warming that has been communicated worldwide is this (fig. 3): CO2 and other greenhouse gases cause global warming and if CO2 emissions are continuously growing global temperatures will do so, too, proportionally.

Figure 3. Communicated mental model of a supposed CO2-driven global warming as a linear chain cause-effect relationship.
If this is true, it will indeed have dramatic consequences. Believing that it is true, huge efforts has been propagated and also taken in many countries in recent years including the introduction of CO2 certificates trading as a questionable tool to mitigate CO2 emissions. To fight Global Warming we have to fight CO2 emissions. That‘s the conclusion.
But what if Global Warming has not been driven by greenhouse gas concentrations or not in the assumed way? Or what if Global Warming takes a different path than projected by the present communicated model due to other dependencies and effects that exist in reality than assumed and described by this model? Can we really afford failing in this matter? Wouldn‘t we have to take other actions in these cases? Maybe rather taking care of aerosol and ozone concentrations, for example?
Also, we have to remind us that we have quite incomplete knowledge and understanding about the complex behavior of the atmosphere and also comparatively short records of reliable observational data, only, so how can we be sure that we are not wrong? We cannot. This is part of the truth. Reality, only, decides if our explanations, expectations, assumptions, descriptions, models are right or not.
An obvious question that comes up now is how do this compare to Intergovernmental Panel of Climate Change (IPCC) projections?
In 2007, the IPCC in the Executive Summary of Chapter 10 on Global Climate Projections of Working Group 1 of its 4th Assessment Report writes:
-
„The future climate change results assessed in this chapter are based on a hierarchy of models, ranging from Atmosphere-Ocean General Circulation Models (AOGCMs) and Earth System Models of Intermediate Complexity (EMICs) to Simple Climate Models (SCMs). These models are forced with concentrations of greenhouse gases and other constituents derived from various emissions scenarios ranging from non-mitigation scenarios to idealised long-term scenarios. ...
-
-
All models assessed here, for all the non-mitigation scenarios considered, project increases in global mean surface air temperature (SAT) continuing over the 21st century, driven mainly by increases in anthropogenic greenhouse gas concentrations, with the warming proportional to the associated radiative forcing. There is close agreement of globally averaged SAT multi-model mean warming for the early 21st century for concentrations derived from the three non-mitigated IPCC Special Report on Emission Scenarios (SRES: B1, A1B and A2) scenarios (including only anthropogenic forcing) run by the AOGCMs (warming averaged for 2011 to 2030 compared to 1980 to 1999 is between +0.64°C and +0.69°C, with a range of only 0.05°C).“ (IPCC, 2007)
The original global warming projections of the three scenarios mentioned in the report, which are explicitly stated being greenhouse gas-driven models (fig. 3) based on different theories, are shown in figure 4.

Figure 4. Multi-model means of surface warming (relative to 1980–1999) for the scenarios A2, A1B and B1, shown as continuations of the 20th-century simulation.
(taken from AR4 IPCC, Global Climate Projections, (IPCC, 2007))
The citation above also points to a major methodological problem of theory-based modeling: Since we - society, science, individuals - have only few and incomplete knowledge about the complex behavior of the atmosphere (or simply, since there is no holistic theory at hand), we have to make many assumptions about the atmosphere, a priori, to fill these gaps to be able to explain, describe, model, predict it. If we do so, however, our assumptions more or less determine the result. If we make different assumptions we may get quite different results. In reverse, this means that to get, show, „proof“ a certain result we only have to find and set up the appropriate assumptions, which is sort of self-affirmation. In other words, if we are forced to make subjective, wild guesses on missing a priori information how reliable, adequate and accurate a predictive model then can be? This is a serious problem in theory-based modeling of complex systems, which the IPCC report is based on, however. An alternative approach has been proposed throughout this project by applying self-organizing knowledge extraction from noisy data (Ivakhnenko, 1968, 1970, 1971; Madala, 1994).
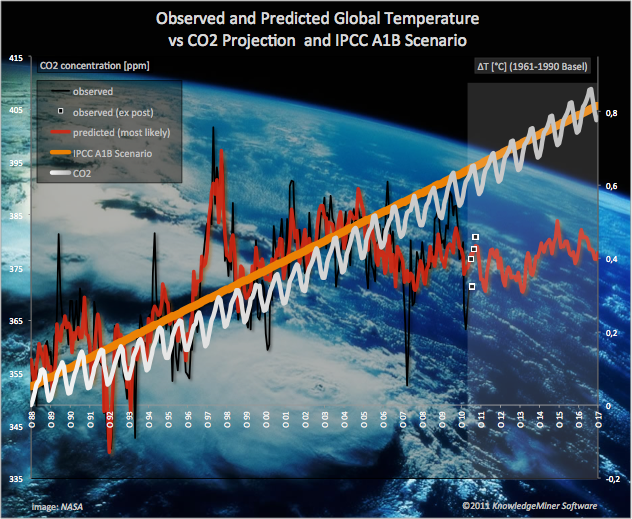
Choosing one scenario of the IPCC report, A1B, representative for the other scenarios and zooming it into the time scale of the presented system model (October 1988 - October 2017) gives a clearer view on what has been projected and what has been observed until now (fig. 5). Figure 5 adds to the observed and predicted temperature curves of figure 1 observed and predicted CO2 concentration and the IPCC A1B projection in the same temperature scale.

Figure 5. Observed (black) and predicted (red) global warming compared to atmospheric CO2 concentration (observed and predicted, white) and IPCC A1B Scenario (yellow) from October 1988 to October 2017.
There is a strong correlation between IPCC scenario and CO2 concentration while IPCC projection and observed (and predicted) global warming increasingly diverge over time.
The first observation of this chart is that the trend of the CO2 concentration curve and the IPCC projection are highly correlated, which is not surprising, because the IPCC projection is entirely based on assumed greenhouse gas-driven models (see description above). This projection reflects what was built into it. This is good. But if it‘s also correct is confirmed by actual temperature measurements, only.
The second finding is that IPCC projection and actual monthly global warming are starting to diverge: Actual warming of the past 5 years (summer 2006 to summer 2011) is lower than expected (average warming of 0.4°C compared to an IPCC projected average warming of 0.58°C on 1961-1990 base) and appears to move out of the projected trend. This may change again in the next several years since temperatures show a very high fluctuation, but it‘s the first time looking back 23 years that this is the case. It is also important to note that projections of the past 5 years are the first ones that has not been justified and based on historical data - it is true prediction in time as the IPCC report was published in 2007. It therefore is an indication of the true predictive power, accuracy and validity of this projection.
The observation of diverging IPCC projected A1B scenario based on CO2-driven models and actual warming amplifies when looking farther into the future using the predictions of the presented system model - which, of course, are open and have to be confirmed by future measurements, too. But we think that there is evidence, already, that makes it necessary and opportune to discuss these questions seriously and openly.
We proposed a powerful, proven and promising modeling by self-organizing knowledge extraction from data approach that has been applied to various real-world problems in the past (Farlow, 1984). The presented dynamic system model of global warming obtained by this self-learning modeling based on monthly data shows a high and reasonable accuracy on both historical and first predicted data, which up to now confirms its predictive power. It describes the complex behavior of global warming more adequately by interdependent, dynamic relationships between sun activity, ozone concentration, radiative cloud fraction, and aerosols. Atmospheric CO2 concentration has not been identified by the system model as major force of global warming. In fact, the model works without any direct impact of CO2 on warming.
We are providing these results free. Models implemented in Excel and the self-organizing modeling software KnowledgeMiner can be downloaded here. You can also leave a comment in our summary blog or contact us directly about more info.
Frank Lemke
KnowledgeMiner Software
Literature
Farlow, S.J. (ed.): Self-Organizing methods in Modeling. GMDH Type Algorithm. Marcel Dekker. New York, Basel. 1984
IPCC, 2007: Meehl, G.A., T.F. Stocker, W.D. Collins, P. Friedlingstein, A.T. Gaye, J.M. Gregory, A. Kitoh, R. Knutti, J.M. Murphy, A. Noda, S.C.B. Raper, I.G. Watterson, A.J. Weaver and Z.-C. Zhao, 2007: Global Climate Projections. In: Climate Change 2007: The Physical Science Basis. Contribution of Working Group I to the Fourth Assessment Report of the Intergovernmental Panel on Climate Change [Solomon, S., D. Qin, M. Manning, Z. Chen, M. Marquis, K.B. Averyt, M. Tignor and H.L. Miller (eds.)]. Cambridge University Press, Cambridge, United Kingdom and New York, NY, USA.
Ivakhnenko A.G.: Group Method of Data Handling as a Rival of Stochastic Approximation Method, Journal “Soviet Automatic Control”, Nо. 3 (1968), pp. 58-72.
Ivakhnenko A.G.: Heuristic Self-Organization in Problems of Automatic Control, Automatica (IFAC), No 6 (1970), pp. 207-219
Ivakhnenko A.G.: Polynomial theory of complex systems, IEEE Trans. Sys., Man and Cyb., 1 (1971), No 4, pp. 364-378.
Madala, H.R., Ivakhnenko, A.G.: Inductive Learning Algorithms for Complex Systems Modelling. CRC Press Inc..Boca Raton, Ann Arbor, London, Tokyo. 1994
Müller, J.-A., Lemke, F.: Self-Organising Data Mining. Libri, Hamburg, 2000
Data Sources:
Ozone, aerosols, clouds:
http://toms.gsfc.nasa.gov/ozone/
Sun activity:
http://solarscience.msfc.nasa.gov/SunspotCycle.shtml
CO2:
http://www.esrl.noaa.gov/gmd/ccgg/trends/
Global warming:
The objective of this project is doing modeling and prediction of global warming and related problems through self-organizing knowledge extraction from public data. The project is impartial and has no hidden personal, financial, political or other interests. It is entirely independent, transparent, and open in results.

