Global Warming Prediction Project

Prediction of CO2 Concentration till 2030
27.06.2011

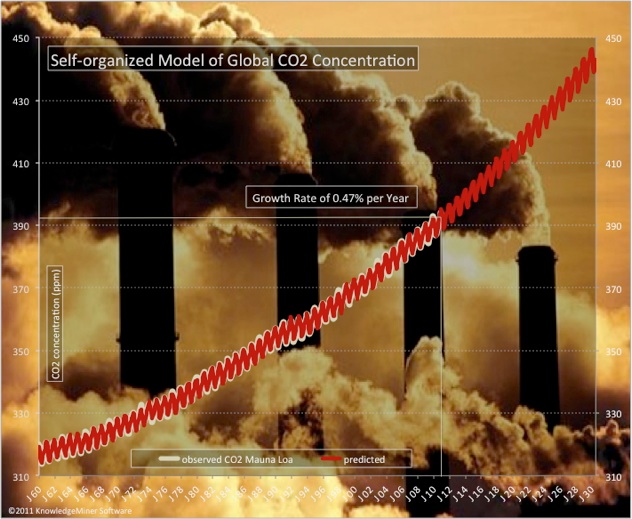
The obtained, simple predictive model describes 99% of the observed monthly Mauna Loa CO2 records measured at an altitude of 3400 m. It shows a current average CO2 growth rate of 0.47 % per year (fig. 1):
CO2(t) = 1.018 * CO2(t-12) - 4.8.

Figure 1. Observed and predicted CO2 concentration from June 1960 to June 2030.
The annual fluctuations are due to seasonal variations in CO2 consumption by land plants. In the northern hemisphere are many more forests than in the south which is why more CO2 is removed from the atmosphere during northern hemisphere summer.
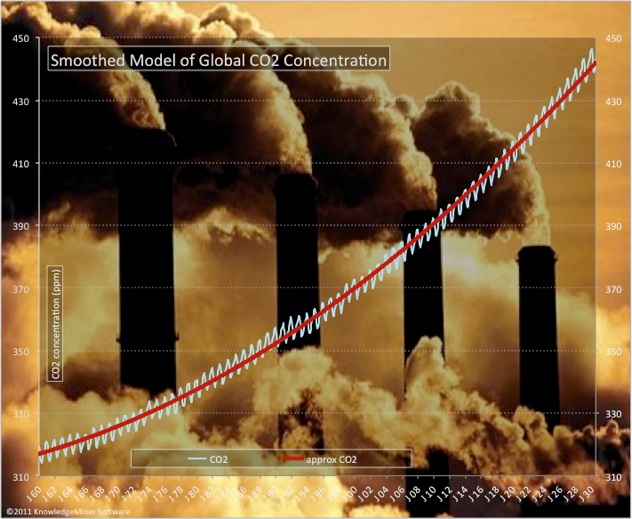
For simplicity and visibility, it is possible to smooth the data by the approximation model shown in fig. 2. This model is a common quadratic trend function of time which is valid for the displayed period of time, i.e., it should not be used for extrapolation purposes:
CO2(t) = a * (t - t0) 2 + b * (t - t0) + c,
with t - t0: number of months since June 1960 (t0), a, b, c: estimated parameters.

Figure 2. Approximated trend function describing the period June 1960 to June 2030.
Any impressions and thoughts when viewing these charts?
The objective of this project is doing monthly modeling and prediction of global temperature anomalies through self-organizing knowledge extraction from public data. The project is impartial and has no hidden personal, financial, political or other interests. It is entirely independent, transparent, and open in results.

