Global Warming Prediction Project

Ozone Concentration Prediction
22.06.2011

This is the first result of global ozone concentration modeling through self-organizing knowledge mining from historical data. This data set, as the only source of information, has been built from public NASA satellite data, namely the Nimbus-7, Earth Probe, and OMI spacecrafts. Overall, they cover the observational period from Nov 1978 to Dec 2010 in form of zonal, hemispheric, and global monthly mean values. In addition to these satellite data observed and predicted sunspot numbers data and observed CO2 concentration data recorded by NOAA at Mauna Loa, Hawaii, has been used for modeling so that the entire data set is composed of these 5 variables:
-
‣Global Ozone concentration [DU] (Dobson Units) (x1),
-
‣Global Radiative Cloud Fraction (x2),
-
‣Global Aerosol Index (x3),
-
‣Global CO2 concentration [ppm] (x4),
-
‣Sunspot Numbers (x5).
The satellite data contain missing values, especially the entire period from May 1993 to July 1996 is missing. These data have been predicted/ interpolated by self-organized models that show an accuracy of 90% and above which is evidence that missing data is approximated well. Nonetheless, this adds noise and uncertainty to the data. However, we even have to consider the observed data as noisy data which the modeling algorithm has to deal with appropriately so the approximated missing data should not bias the results too much. (In fact, we did build models on different time periods and the results are similar.)
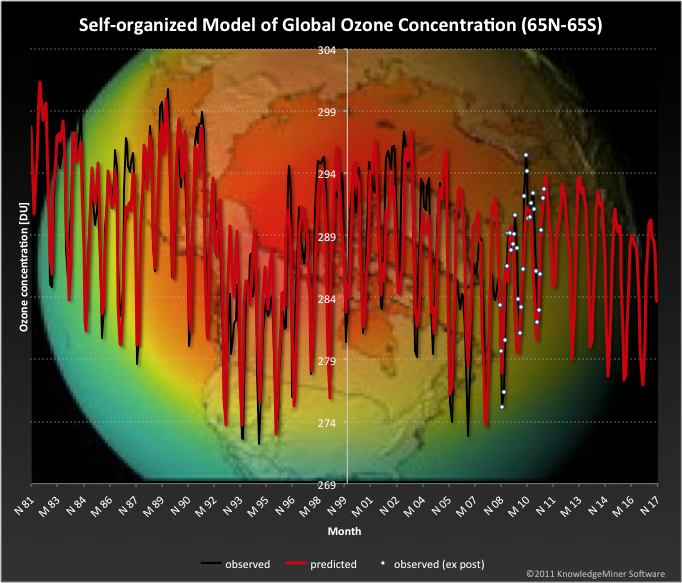
The model displayed in the graph below was developed from data of the period Nov 1978 to Oct 2008 using a maximum time lag of 36 months. The data till Dec 2010 has been used ex post (out-of-sample) for model evaluation. The model represents a non-linear difference equation of these self-selected input variables:
x1(t) = f(x2(t-i), x3(t-j), x5(t-2)),
with i = {0, 6, 30, 35, 36}, j = {0, 1, 4, 12, 23, 30}. In other words, global ozone concentration at a time t is described by radiative cloud fraction, aerosol index, and sunspot numbers at current and/or previous points in time.
The accuracy of this best model is 82% (R2, coefficient of determination, using leave-one-out cross-validation) at a Descriptive Power of 43% and a high model robustness within the forecast horizon of Jan 2011 to Oct 2017.

The underlying data are available on request.
The objective of this project is doing monthly modeling and prediction of global temperature anomalies through self-organizing knowledge extraction from public data. The project is impartial and has no hidden personal, financial, political or other interests. It is entirely independent, transparent, and open in results.

